JOB REPORT
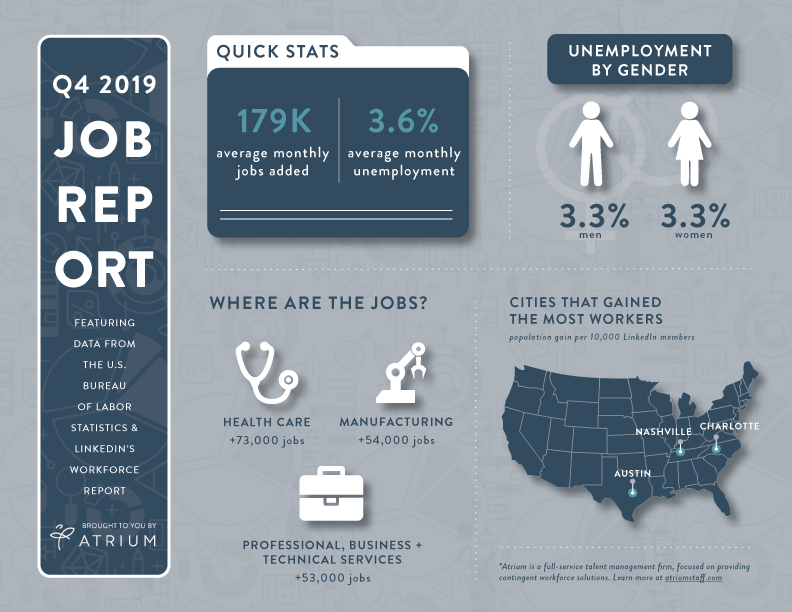
Combining stats from the Bureau of Labor Statistics’ monthly Employment Situation Report with data from LinkedIn’s Workforce Report, our Q4 2019 Job Report infographic provides you with a quick summary of the last quarter in 2019.

Click here for an enlarged version of the infographic.
LEGAL UPDATES
Below is a round-up of the top workforce and labor-related legal updates that occurred within Q4:
October 2019: Court Forces EEOC to Continue Collecting Pay Data
A federal judge ordered the EEOC to continue collecting pay data for 2017 and 2018 ruling that an insufficient number of employees have submitted their revised EEO-2 reports. The court ordered the agency to continue and complete the process by January 31, 2020.
November 2019: DOL Announced a Proposed Rule to Allow Job Creators to Offer Bonuses & Incentive-based Pay for Employees with Fluctuating Workweeks
This proposed rulemaking would revise the Department of Labor’s regulation for computing overtime compensation for salaried nonexempt employees who work hours that vary each week (fluctuating workweek) under the Fair Labor Standards Act (FLSA or the Act).
December 2019: Labor Department Offers Employees Some FLSA Clarity Through New “Regular Rate” Interpretation
On December 16, 2019, the U.S. Department of Labor (Department) published a Final Rule updating the regulations governing regular rate requirements under the Fair Labor Standards Act (FLSA). The rule marks the first significant change in over 50 years and will allow employers to more easily offer perks and benefits to their employees.
SUMMARY OF Q4 JOB REPORT:
Average Monthly Jobs Added: 179,666
Average Monthly Unemployment: 3.6%
UNEMPLOYMENT BY GENDER:
Male: 3.3%
Female: 3.3%
WHERE ARE THE JOBS?:
Healthcare: +73,000 jobs
Professional, Business and Technical Services: +53,000 jobs
Manufacturing: +54,000 jobs
CITIES THAT GAINED THE MOST WORKERS:
Austin, TX
Nashville, TN
Charlotte, NC


